Kara Sulia is turning early meteorological dreams into the reality of a new database for ice-crystal shapes
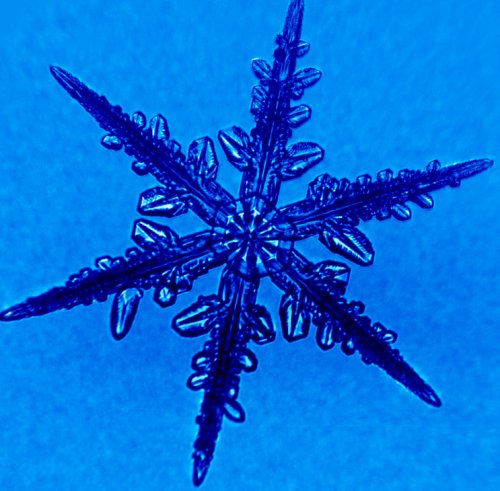
From 2000 to 2020, eight atmospheric science field campaigns deployed specialty cameras mounted on the underside of research aircraft to sweep up 8.6 million images from which a database of ice crystals and cloud water droplets was established. All eight campaigns (and others that will add to the database later) were funded at least in part by the U.S. Department of Energy (DOE).
There were many more such campaigns and images, but this specific collection of data is at the heart of a long-term project underway at the University at Albany – State University of New York. The project, which just started its cycle of funding in October 2020 through DOE’s Atmospheric System Research (ASR) program , employs machine learning to characterize and categorize ice particles. Data are collected from DOE field campaigns.
The ASR work is led by research associate Kara Sulia, an ice-crystal growth theorist at Albany’s Atmospheric Sciences Research Center. Her ice-particle shape project has a suitably aerial acronym, COCPIT, which stands for Classification of Cloud Particle Imagery and Thermodynamics.
Good and Bad Habits
The automated instrument used to collect such images, some of them startlingly detailed and vivid, is the cloud particle imager (CPI), a workhorse device in many atmospheric research aircraft. The bullet-shaped CPI, mounted beneath the aircraft, has a tube-shaped sampler where particles passing through are snapped at 75 frames a second, with each frame capturing about 25 particle images. (Upgraded CPIs are now capable of 500 frames per second.)
Weighing 36 pounds and 26 inches long, both the old and new versions of the CPI “are giant compared to other pylon probes,” says Pacific Northwest National Laboratory atmospheric scientist Fan Mei, who is the CPI instrument mentor for the DOE’s Atmospheric Radiation Measurement (ARM) user facility. “It captures (images of) lovely large droplets and crystals.”
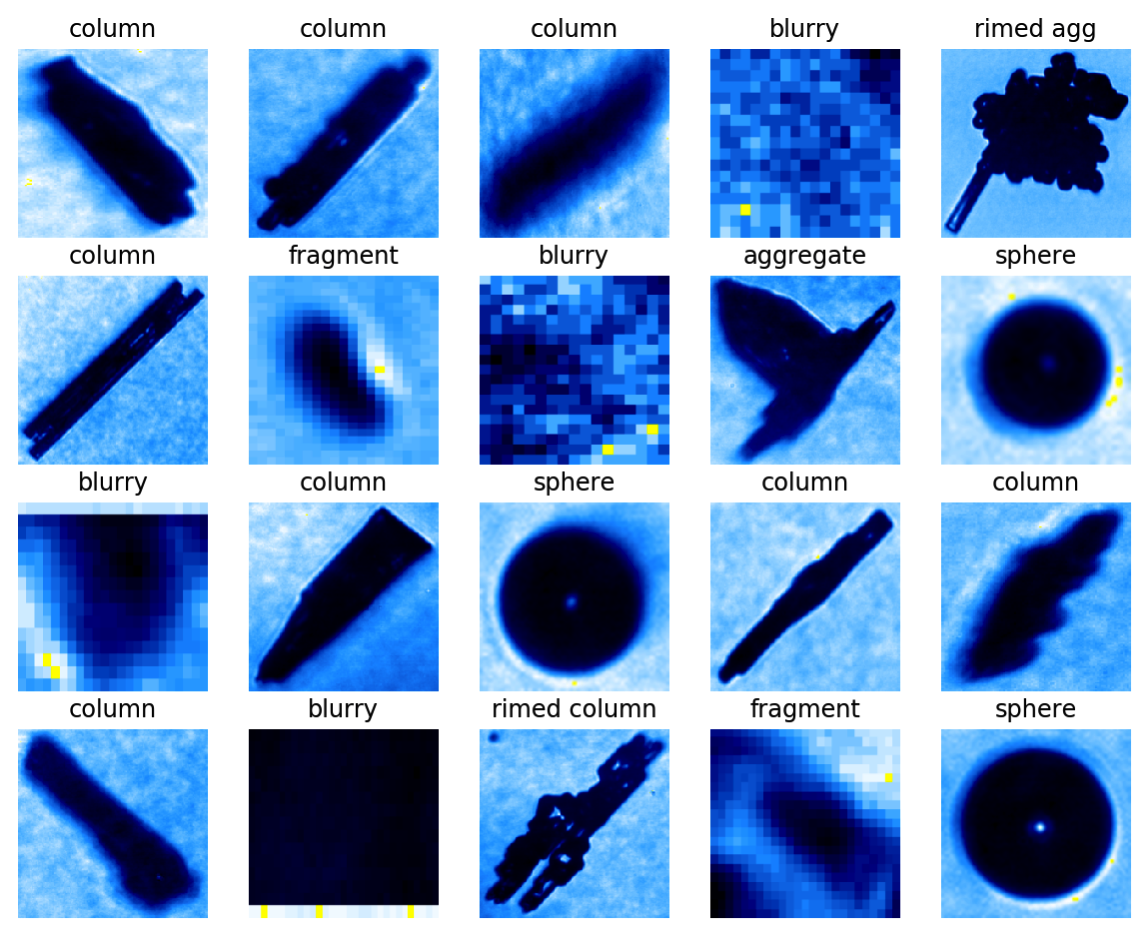
Linked to a 50-pound data system inside the research aircraft, CPI instruments gather pictures of ice crystals, cloud water droplets, fragments, blank images, and blurry images. For purposes of Sulia’s ice-targeted work, specialized software filters out everything but the images of ice crystals. Because the data on fragments might be useful someday, they are saved.
“Our focus right now is on clear, pristine images,” says Sulia, who estimates a winnowed working database to be about 800,000 pictures. Her team is sorting them by shape with machine learning algorithms.
Key to the effort is Albany PhD candidate Vanessa Przybylo. Most of her graduate work has been funded through ASR projects.
Fetch, Filter, Analyze
The intent of COCPIT is to develop a cohesive framework for what Sulia calls “a more seamless interaction” with CPI images. They each measure 2.3 microns across, but in a raw-data state, are compressed about 1,000 times.
At the moment, there is no user-friendly, open-source tool for using CPI data. There is also no current way researchers can get a sense of predominant crystal types in a given cloud region or any detailed properties COCPIT would provide.
Sulia’s vision is to categorize ice-crystal images by shape, then create linked metadata that records contextual information. This would include not only information about the particles themselves but also the environment in which they were captured (temperature and altitude, for instance) and the field campaign from which the images originated.
All this will enable researchers to derive the microphysical details of specific case studies during DOE campaigns. Through COCPIT, says Sulia, they can “easily fetch, filter, and analyze these data, and perhaps get a better handle on the system they are investigating.”
The eight campaigns Sulia is tapping for data are or were fully or partly funded by the DOE―in some cases by ARM, the user facility.
One example is the 2008 Indirect and Semi-Direct Aerosol Campaign (ISDAC), which involved ground-based and airborne instrument platforms at ARM’s North Slope of Alaska atmospheric observatory.
To make sense of such data, Sulia’s team had to write the code to filter out liquid drops, establish a software interface to process the raw data, and chop it into sheets of images.
“That was months and months and months of tedious script-writing,” says Sulia.
An Iterative Process
Sulia calls COCPIT’s machine learning-aided work “an iterative process. Over time we can recognize when the model has difficulty appropriately categorizing a crystal type. As more data is fed into the model, we adjust categories and crystal types.”
After initial training by machine learning, she adds, “millions of images can be processed.”
COCPIT is informed by some urgent needs.
For one, millions of images are captured by CPI devices during field campaigns. But that’s too much data for one person to analyze for type, properties, and growth environment―the kind of information needed to visualize the evolution of a particular cloud system.
Categorizing cloud-particle images can help profile the systems that created them. That’s a boon to numerical weather models, which use data about cloud-particle type and ice-crystal shape to accurize their simulations.
Radiative transfer in cloud systems also depends on predicted habits (shapes). So does calculating the mass of precipitation. Missing the difference between a 420-micrometer sphere and a 5- millimeter stellar dendrite, can lead to particle-mass estimates being off by a factor of 15. Meanwhile, correct estimates of particle type improve climate models because thermodynamic feedbacks are linked to particle shape.
Current ice-habit studies often rely on crystal-classification programs that fall short, says Sulia. COCPIT can help by assembling such images in a coherent database, with classifications “done in a systematic and repeatable way.”
Validation accuracies using COCPIT are up around 99%―10 or 15 points above other classification schemes available.
Soon, a CPI Database
In the course of work on COCPIT, Przybylo, in particular, has grappled with a few challenges. These include separating individual images from sheets, or frames of images; dealing with outdated computer interfaces; introducing novel file formats; and the struggle for direct access to CPI data, which sometimes requires reaching out to experts who took part in a given campaign.
Przybylo was behind one important recent step: setting up a pre-processing function for images. Sulia has also hand-labeled an initial dataset and hyperoptimized the machine learning scheme to enable accurate model learning.
Sulia estimates that her COCPIT group will establish a proof-of-concept scheme in three years, including a working CPI database with which DOE users can interact.
She also predicts that more DOE campaigns and millions of additional images (some, perhaps, from sources other than CPI) will expand the machine-learning model’s capabilities and database.
“We are really excited about this project,” says Sulia, “and intend to expand the capabilities we envision beyond three years.”
“We” includes not only the intrepid Przybylo, but Carl Schmitt, a project scientist at the National Center for Atmospheric Research (NCAR) in Boulder, Colorado. He’s an expert in CPI instrumentation and the raw data it generates.
Zachary Lebo, an assistant professor at the University of Wyoming, is in charge of linking the COCPIT project with traditional modeling approaches that may inform CPI particle growth history beyond simply capturing a given particle.
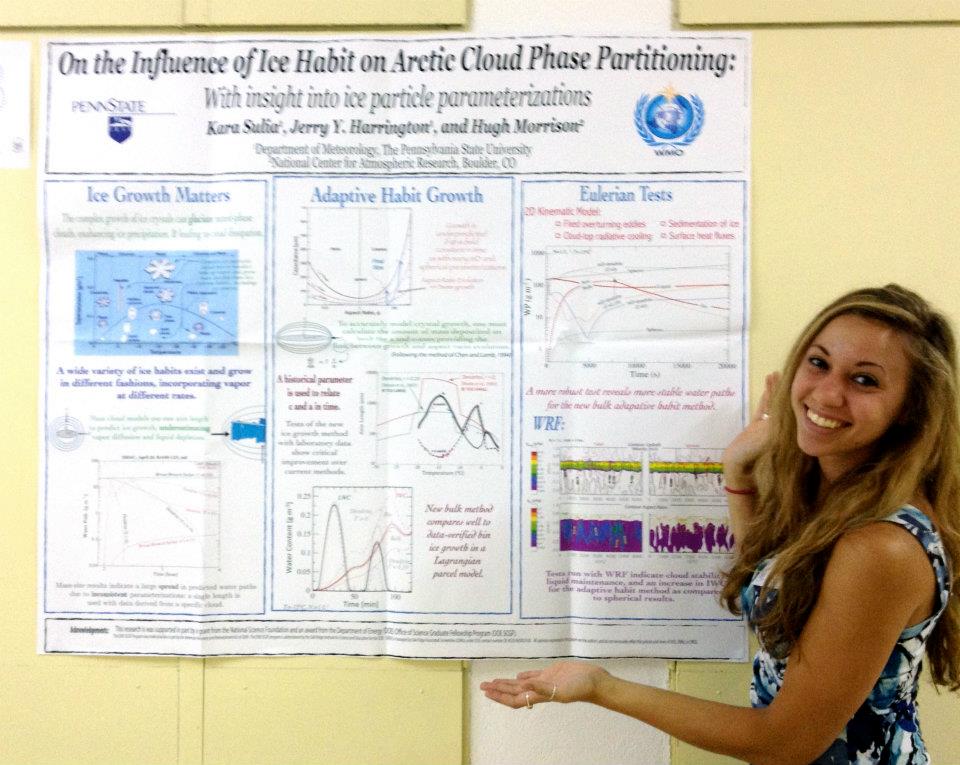
Early Dreams and Ambitions
As it happens, Lebo was a couple of years ahead of Sulia at Pennsylvania State University, where she earned her degrees in meteorology (B.S. 2009, PhD 2013).
For the longest time, Penn State loomed large in her imagination.
Sulia was in fourth grade in her native Cookstown, New Jersey, when―inspired by her older sister Justine―she decided to become a broadcast meteorologist. (Her father was a logistics officer in the U.S. Air Force at nearby McGuire Air Force Base, where now, as a civilian, he is Inspector General; her mother is a grade-school teacher.)
By sixth grade, Sulia had settled on the exact university she would attend and all through high school “everything I did was to get into Penn State.” That included AP calculus and a half-day weekly internship one year with the National Weather Service.
In college, Sulia participated in Campus Weather Service, doing both TV and radio work―but without much joy.
Instead, she dug into all the “nitty-gritty math and physics” classes she could find. During a NASA internship one summer, Sulia did her first coding and software script writing.
As Sulia took a hard turn towards research, professors Jerry Harrington and Jon Nese were special influences.
Shape Matters
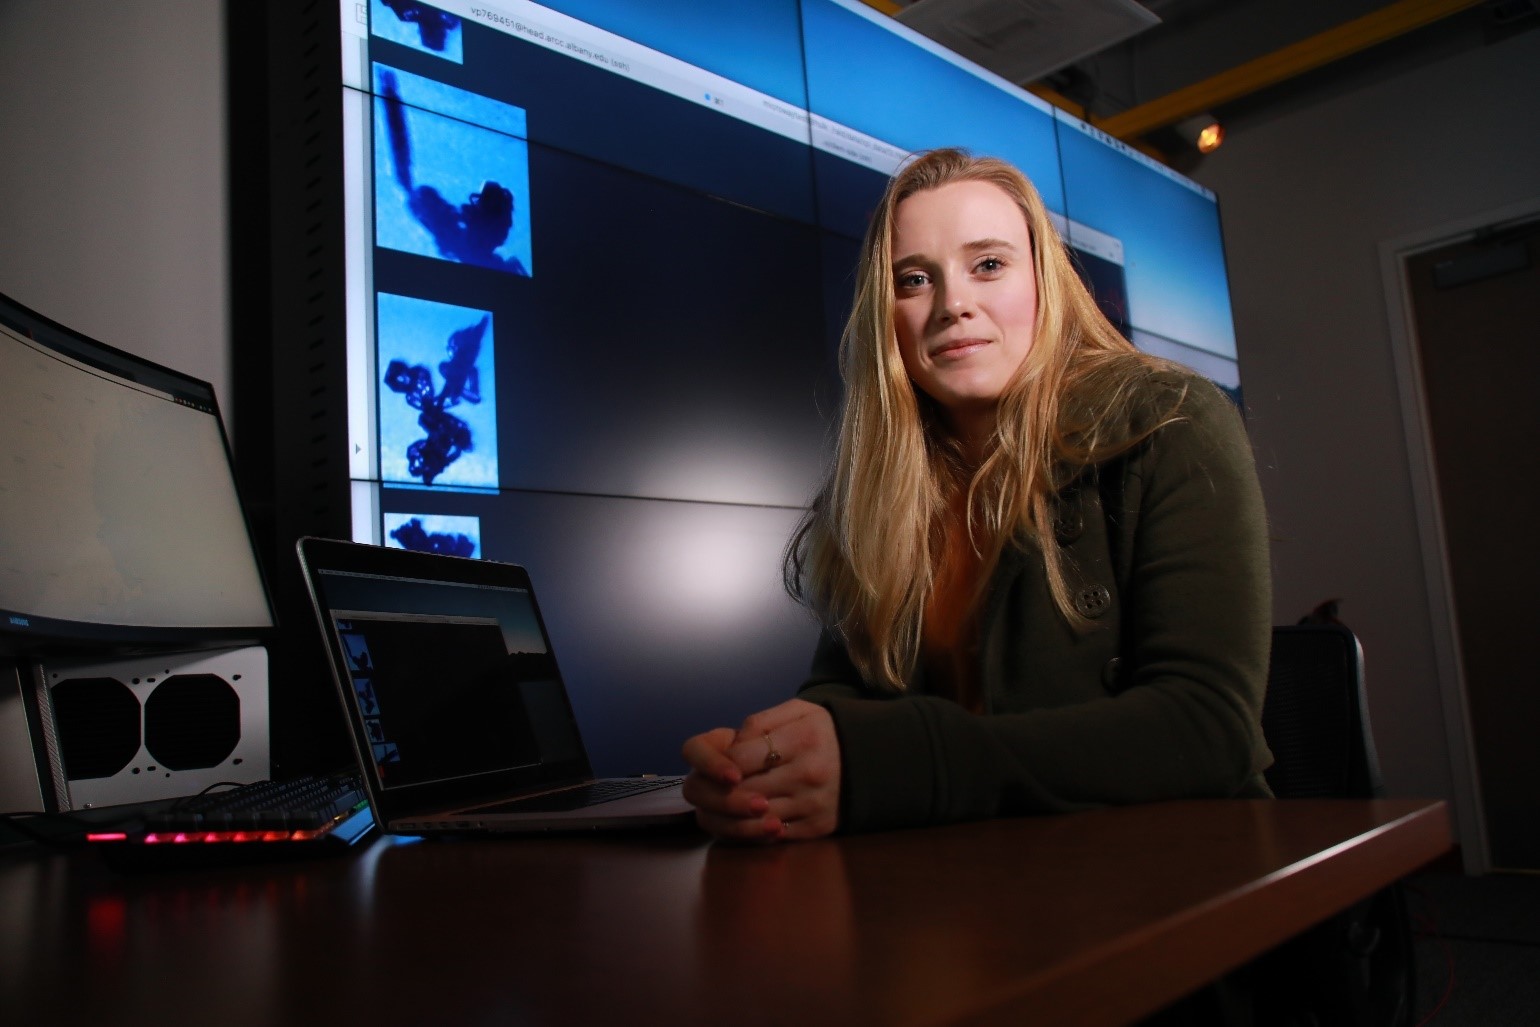
In the PhD program at Penn State, Sulia worked a lot with Eugene Clothiaux and (extensively, she says) Johannes Verlinde.
Verlinde was lead scientist on a 2004 ARM field campaign called the Mixed-Phase Arctic Cloud Experiment (M-PACE), which also generated CPI data Sulia is using for COCPIT.
Her dissertation work―on improving a model that predicts ice particles―foreshadowed what she does now. It was on a model that captured changing particle shapes and how they evolved over time.
Shape matters in ice particles, including their fall speed through the atmosphere and the difference in radiative effect determined by shape, whether plate, column, or sphere.
To this day, some model parameters assume that ice particles are shaped like spheres. Sulia’s dissertation “allowed for a better prediction of mass and energy budget.”
However, the PhD work was about the growth of individual ice particles. Today, her work is about such particles in the aggregate. In fact, it is “a new way to represent the aggregation of different ice particles with different shapes,” says Sulia.
That new way started with her 2016-2019 ASR project, which wrapped up in the fall of 2020. It was not intended to fund a version of COCPIT but to investigate the evolution of ice-particle size distribution in mixed-phase clouds.
Being in Shape Matters
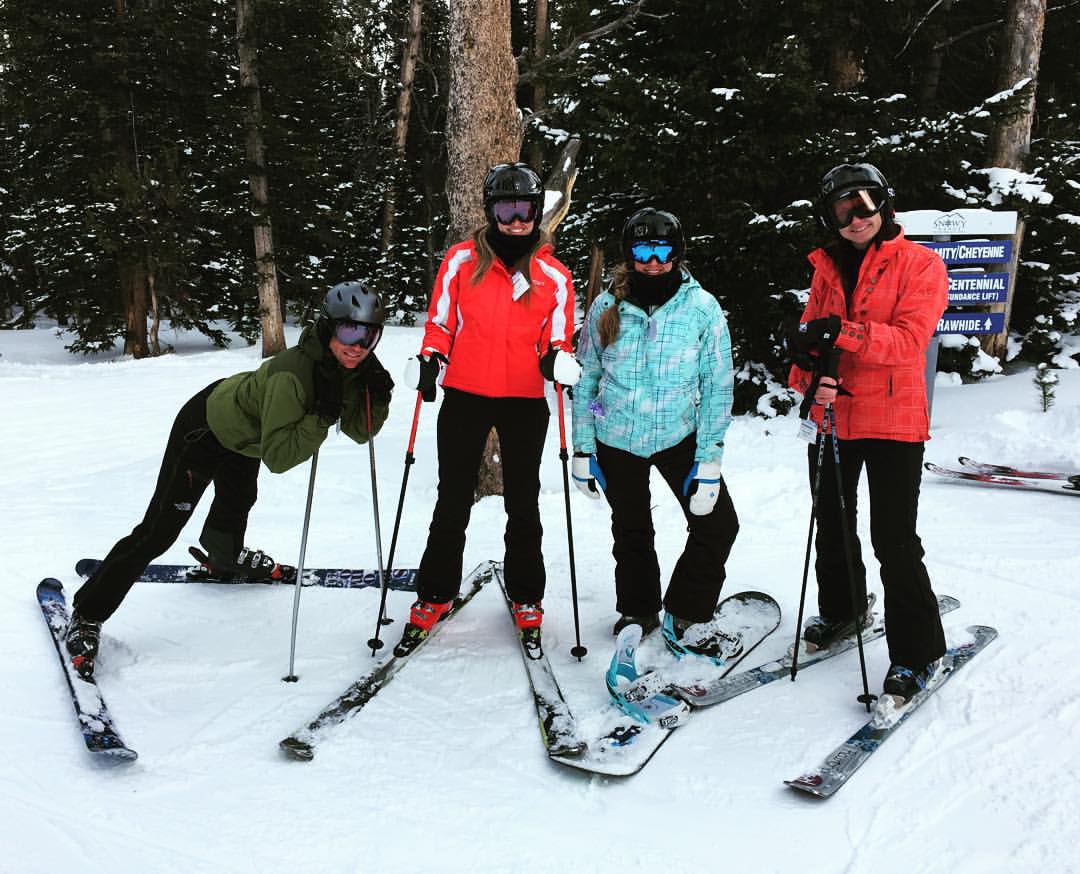
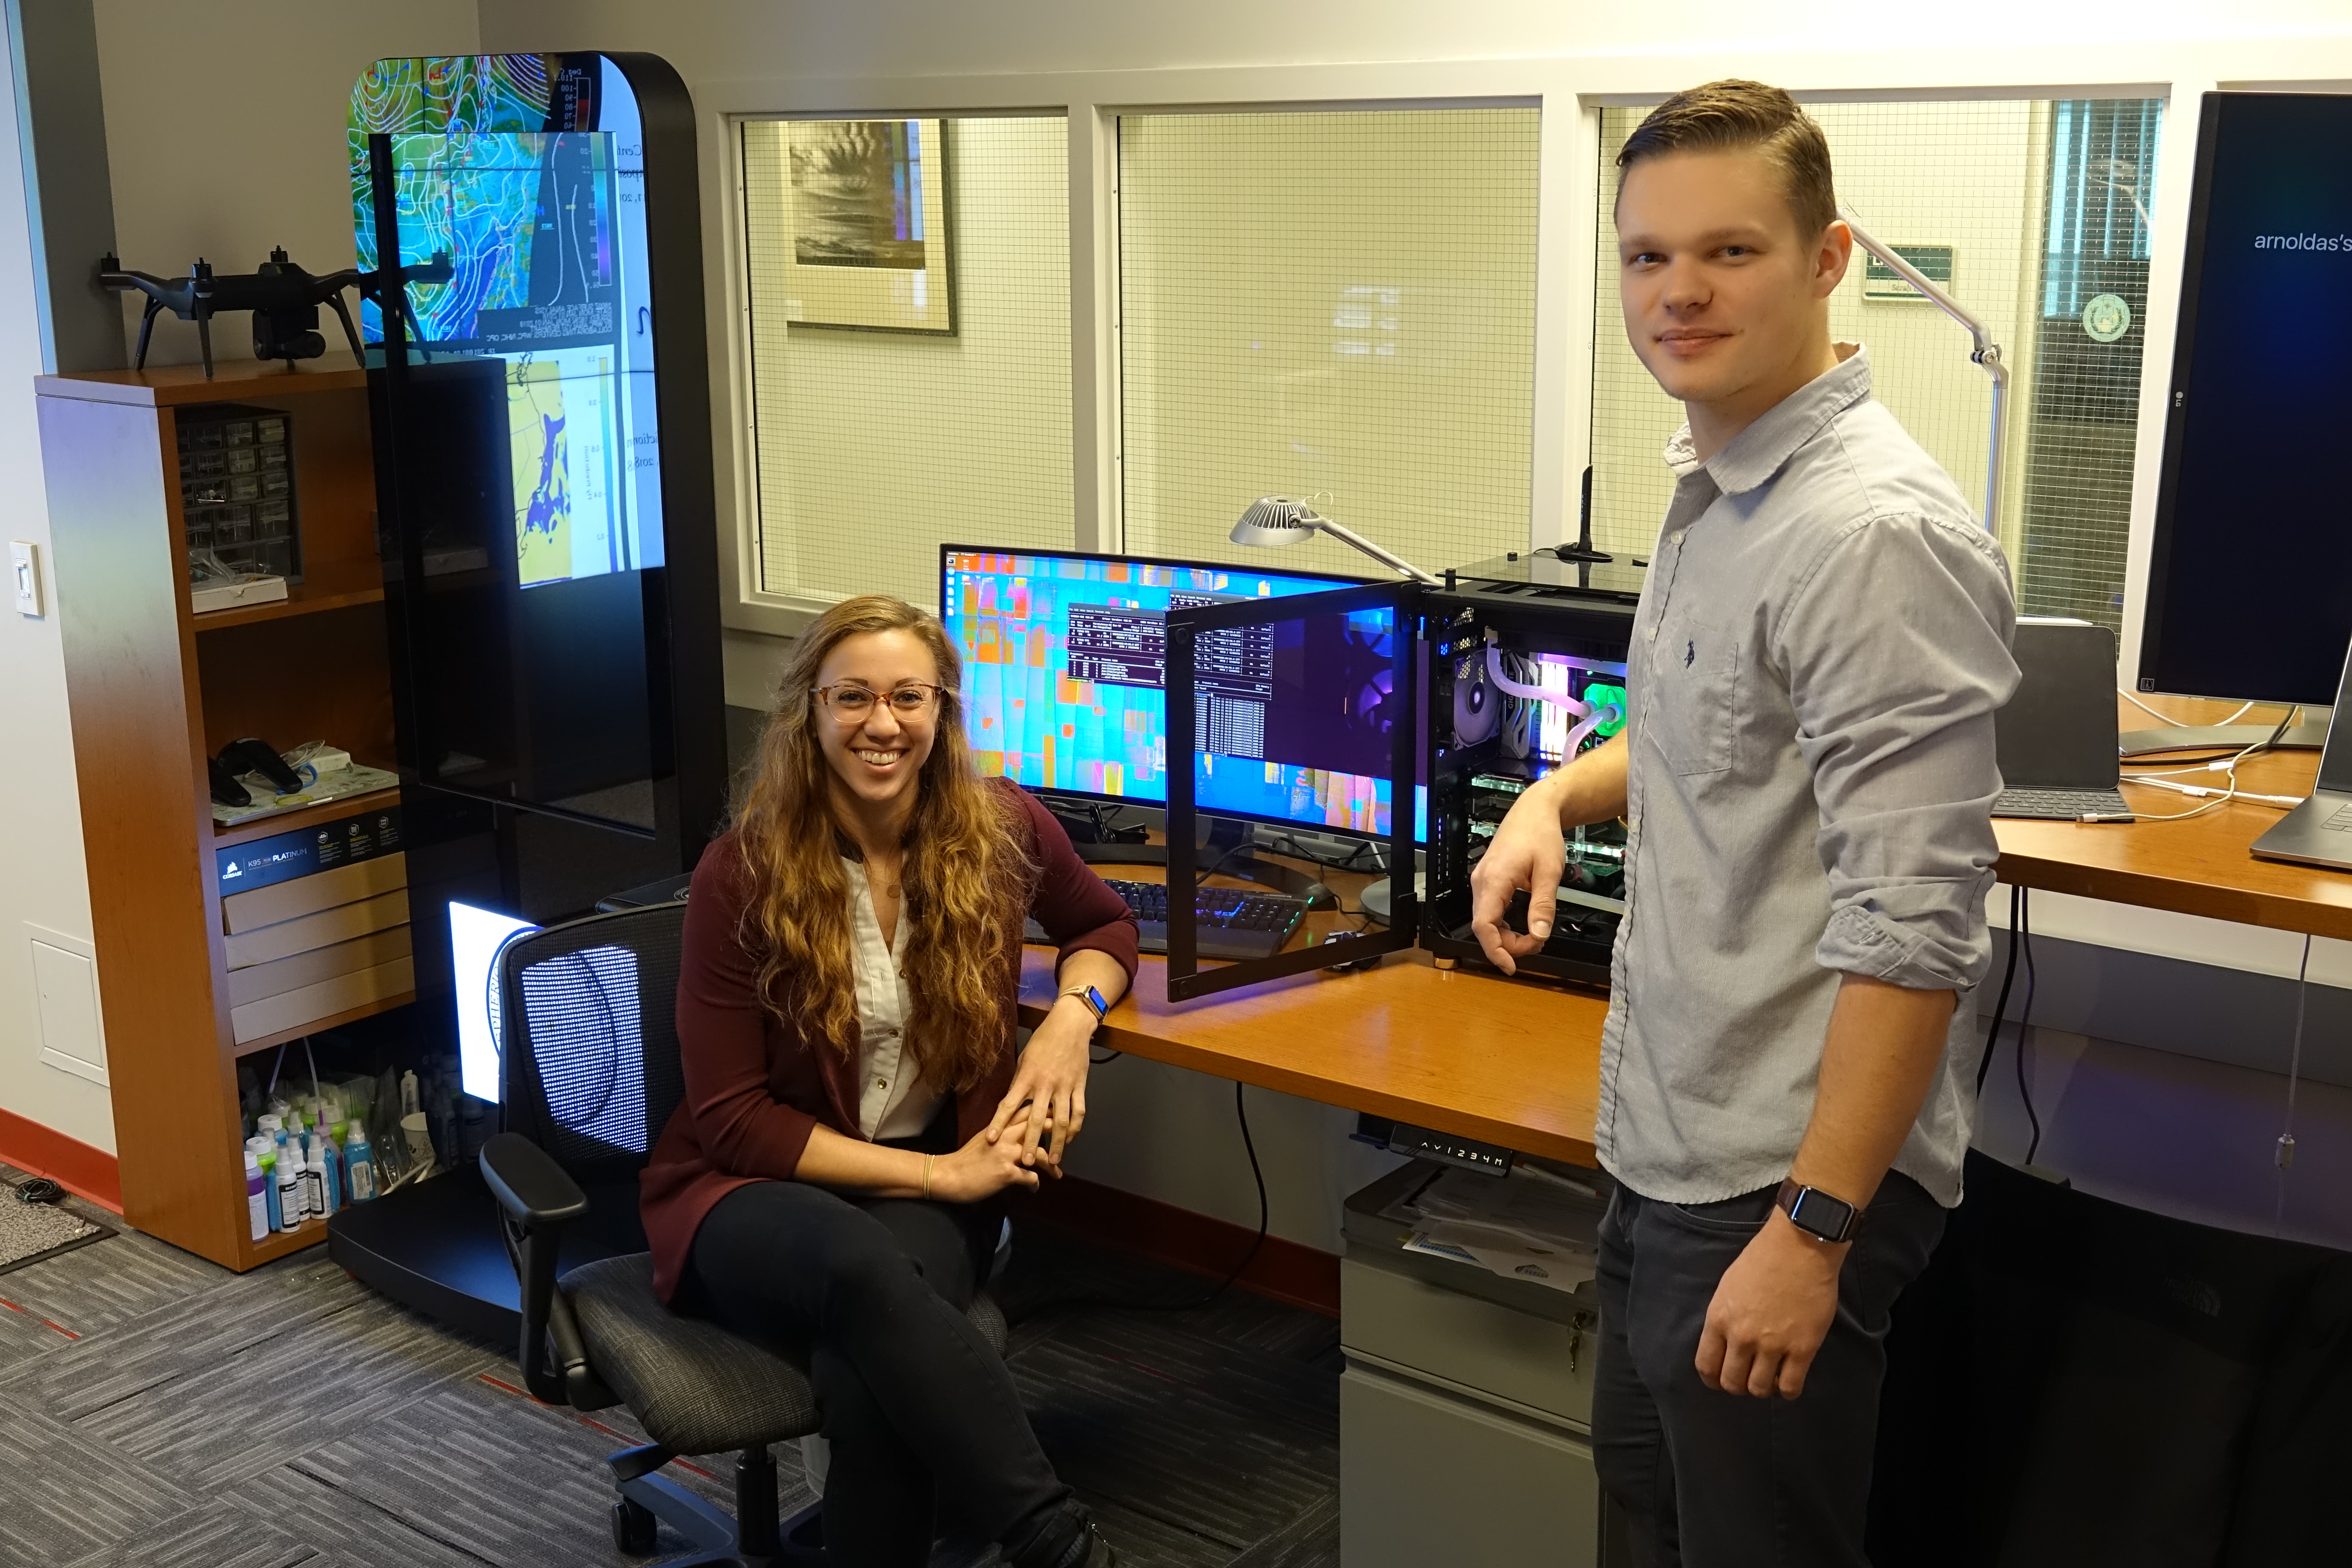
Aside from COCPIT, Sulia is also busy as director of a data and visual analytics center at Albany called ExTREME Collaboration, Innovation, and Technology―xCITE, for short. Machine learning is among the pursuits there.
The xCITE center represents one of the two directions Sulia says her career is taking. One, as for years, is the science of meteorology. Another is computer science and software development. (At Albany, to illustrate, Sulia is a candidate for a bachelor’s degree in computer science.)
“I am marrying the two as much as I can,” she says.
The center, for instance, not only helps support the ASR work. But it is also at the heart of funding partnerships with the New York State Energy Research and Development Authority. Sulia and others, for instance, are leveraging the tools of meteorology to predict electricity loads and outages. They are also investigating ways to do photovoltaic forecasting of direct solar radiation.
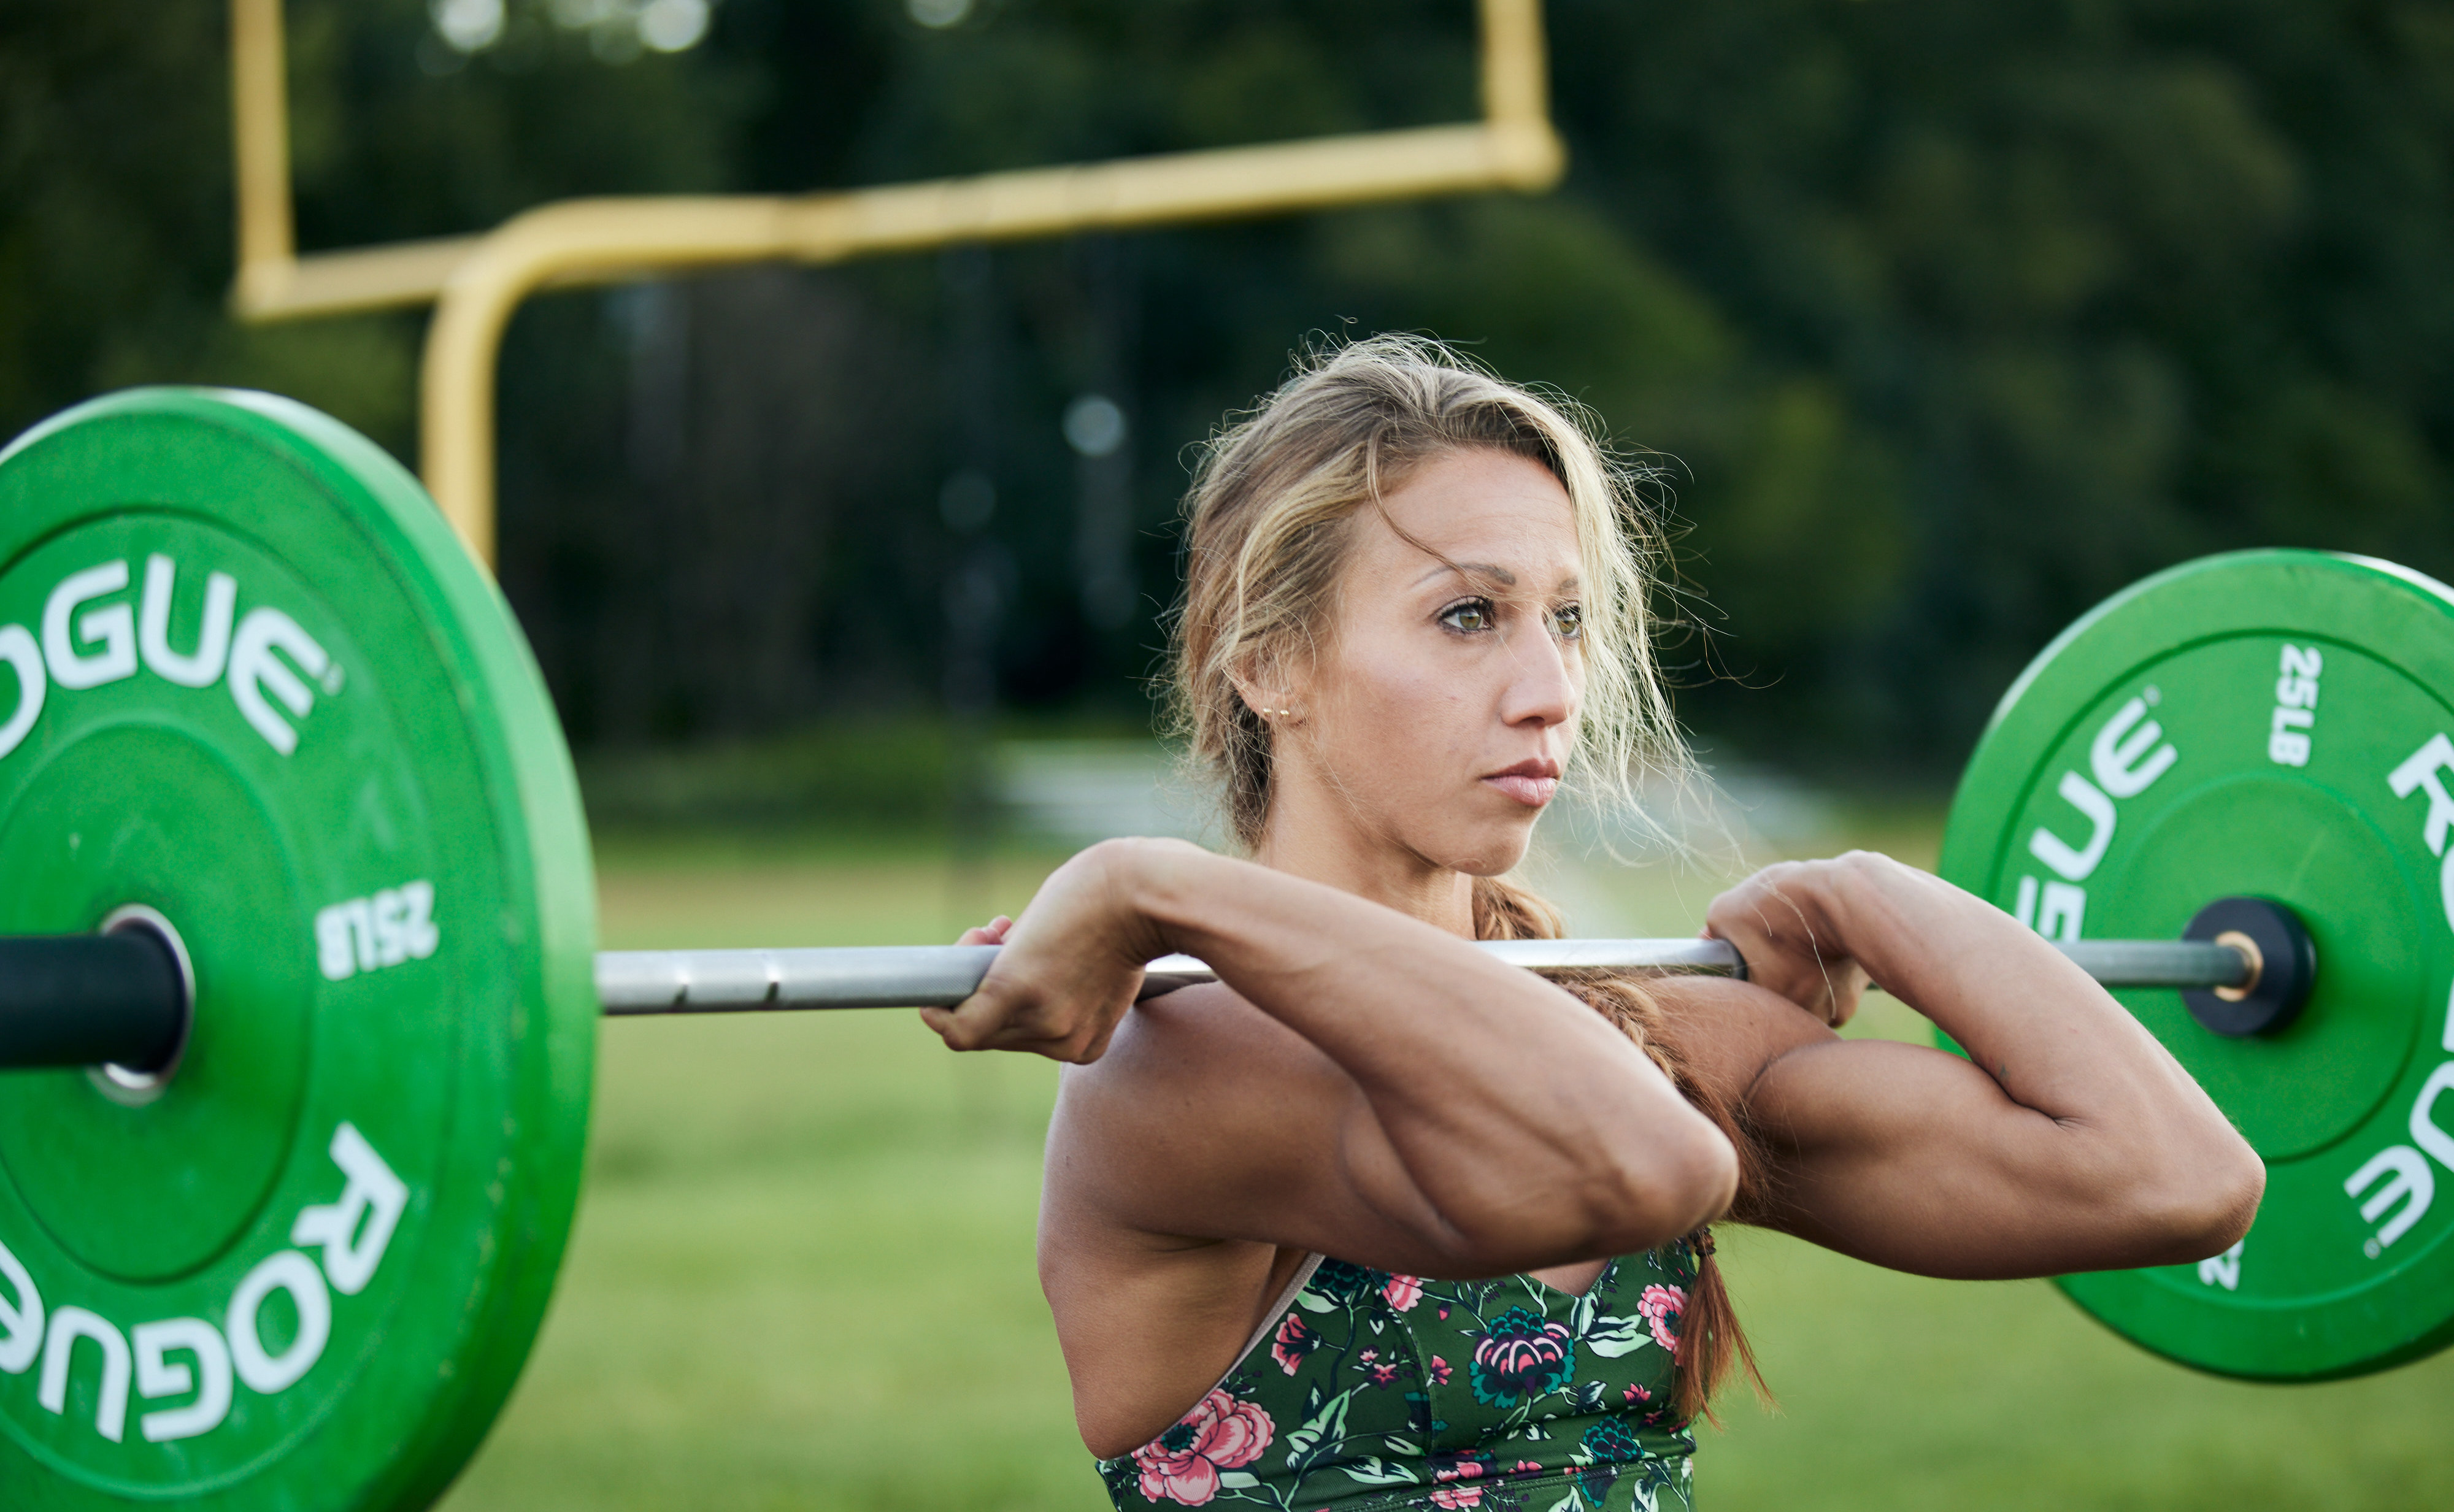
While some of her work involves investigating a variety of shapes, Sulia is also busy, outside of science, staying in shape. She works out every day with a high-intensity exercise regime and lifestyle called CrossFit.
Says Sulia, “That’s the second thing that takes most of my time.”
# # #Author: Corydon Ireland, Staff Writer, Pacific Northwest National Laboratory
This work was supported by the U.S. Department of Energy’s Office of Science, through the Biological and Environmental Research program as part of the Atmospheric System Research program.

