AERI-ER at the SHEBA Ice Station: Far Infrared H2O Continuum
Submitter
Revercomb, Henry E. — University of Wisconsin, Madison
Area of research
Radiation Processes
Journal Reference
Tobin, D.C., F.A. Best, P.D. Brown, S.A. Clough, R.G. Dedecker, R.G. Ellingson, R.K. Garcia, H.B. Howell, R.O. Knuteson, E.J. Mlawer, H.E. Revercomb, J.F. Short, P.F.W. van Delst, and V.P. Walden, 1999. "Downwelling spectral radiance observations at the SHEBA ice station: Water vapor continuum measurements from 17 to 26μm," JGR 104(D2): 2081-2092
Science
For an accurate understanding of Earth's climate, it is essential to know the spectral absorption properties of water vapor, in addition to how its distribution depends on geographic location and altitude. Clough et al. (1992), Sinha and Harries (1995), and Stamnes et al. (1998) have shown the importance of the transparent portion of the water vapor rotational band from 250 to 600 cm-1 to Earth's energy balance. Knowledge of radiative transfer for clear skies in this spectral region is important for several reasons: 1) for cold, dry conditions frequently encountered at high latitudes, this spectral region becomes more transparent and strongly influences the near surface contribution to the infrared cooling to space, 2) at high altitudes, similar conditions are also encountered and this region therefore plays a significant role in radiative cooling on a global scale, 3) measurements in this spectral region are useful to theoretical studies of H2O-X collisions and spectral lineshapes, and 4) accurate remote sensing of atmospheric water vapor for both up- and down-looking sensors requires an accurate radiative transfer model near the centers of water vapor ro-vibrational bands.
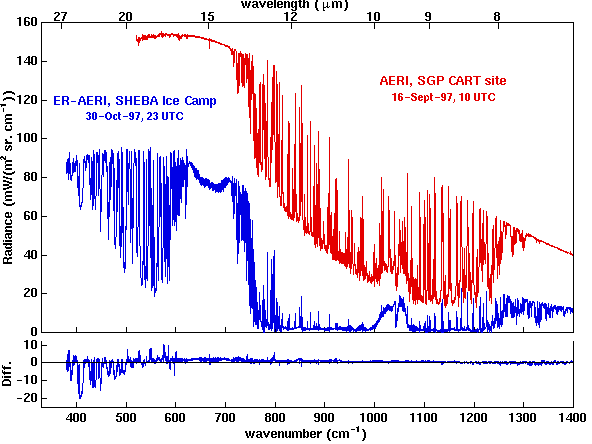
At high latitudes, it is often dry enough that narrow "microwindows", or regions in-between spectral line centers, become transparent in the strong pure rotational band of water vapor. This is illustrated in the top panel of Figure 1, which shows ground-based clear-sky downwelling radiances observed with Atmospheric Emitted Radiance Interferometer (AERI) systems at the Atmospheric Radiation Measurement (ARM) Southern Great Plains (SGP) Cloud and Radiation Testbed (CART) in central Oklahoma on a particularly warm, humid day and at the Surface Heat Budget of the Arctic Ocean (SHEBA) Ice Station under much cooler and drier conditions. For the SGP CART site case, the precipitable water vapor was ~4.0 cm and the near ground air temperature was ~300K, while for the SHEBA case, these values were ~0.35 cm and ~250K, respectively. The underlying envelope of emission for each case is due mainly to the far-wings of spectral lines within the pure rotational band of water vapor. For the SGP CART site spectrum, absorption due to water vapor at ~600 cm-1 and longer wavelengths is large enough such that there is no transmission to space and the detected radiances are equal to the Planck emission at the ambient temperature. For the drier SHEBA case, however, microwindows from ~380 to 600 cm-1 are somewhat transparent, leading to lower observed radiances representative of higher altitudes and colder temperatures. At these lower temperatures, the peak of the Planck function shifts to longer wavelengths and subsequently the transmission properties of the atmosphere in this spectral region are crucial for climate and energy balance related issues. In particular, others (Clough et al., 1992; Ellingson and Wiscombe, 1996; Stamnes et al. 1998) have cited the importance of the water vapor continuum in these issues. Thus, an AERI with extended longwave spectral coverage (AERI-Extended Range, AERI-ER) to ~26 mm was deployed to the SHEBA site, in part for the validation and testing of current clear-sky radiance calculations. The bottom panel of Figure 1 shows the radiance difference (observed-calculated) between the SHEBA AERI-ER spectrum and a line-by-line calculation performed using the CKDv2.2 water vapor continuum model. Large differences in the extended longwave region in-between water vapor spectral line centers are attributed to errors in the air-broadened water vapor continuum absorption and are the focus of this paper.
Impact
The AERI Extended Range extends the longwave cutoff of the useful spectral range of the instrument to longer wavelengths (smaller wavenumbers) than a standard AERI system. This is accomplished by choosing a longwave MCT detector which peaks at longer wavelengths and replacing the optical elements of the interferometer to remove any materials which are optically absorbing in the 400 to 600 cm-1 range. Whereas the noise performance limits the spectral range of the standard AERI to about 525 cm-1, the AERI-ER has similar performance out to 420 cm-1 and is useable with time averaging to beyond 400 cm-1. The tradeoff for this enhanced longwave performance is about a 50 percent degradation of the performance compared to a standard AERI in the 600 to 1500 cm-1 region. The performance in the 1800-3000 cm-1 range is the same for both instruments since a separate InSb detector is used in each case. The radiometric calibration accuracy for the AERI-ER is comparable to that of a standard AERI system, i.e., better than 1 percent of ambient blackbody radiance.
Briefly, in the context of the present work, the water vapor continuum is defined in terms of the "local" lineshape as defined by Clough et al. (1980). (The local absorption coefficient accounts for the cumulative effects of all lines with 25 cm-1 of their respective centers using an assumed lineshape). The continuum is further reduced in terms of its well-known dependence on absorber and broadener densities and is represented by self- and air-broadened continuum coefficients, Cs0 and Cf0, which can vary with wavenumber and temperature. The coefficients represent the cumulative difference over all spectral lines between the total absorption coefficient and the local absorption coefficient. In the Earth's lower atmosphere, continuum absorption in spectral regions near the centers of water vapor bands is generally dominated by air-broadening, while window regions are dominated by self-broadening.
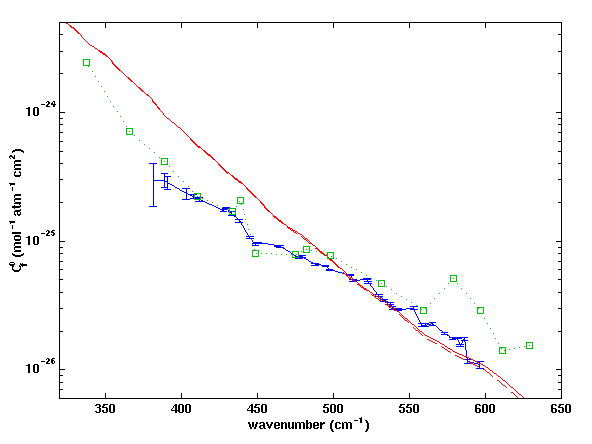
For the ~350-650 cm-1 region, laboratory measurements of Burch et al. (1979) at room temperature have formed the basis of a quantitative development of the water vapor continuum. Based on these measurements and others, Clough et al. (1980) used a semi-empirical lineshape formulation, known as CKDv0 (Clough, Kneizys, and Davies, version 0), to account for Burch's measurements and their deviation from Lorentzian lineshape behavior. In this formulation, Cs0 is dependent on temperature while Cf0 has no temperature dependence. Empirical modifications to CKDv0, based on various atmospheric and laboratory observations, have resulted in subsequent CKD versions, the latest of which is CKDv2.2. Although other spectral regions have undergone significant changes from CKDv0 to CKDv2.2, the 400-600 cm-1 region has not. Until now, improvements and/or validation of the continuum models in the 400-600 cm-1 region have been limited by a lack of observations; the work presented here contributes by providing the first observations of Cf0 in this region since Burch's original laboratory measurements. Collected at lower temperatures, these measurements may also provide information about the temperature dependence.
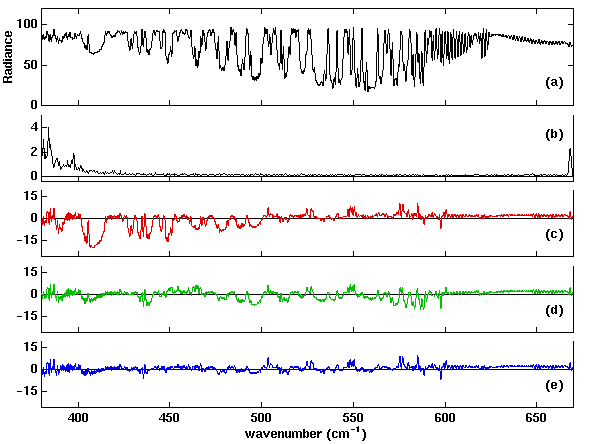
Line-by-line calculations of downwelling radiances were compared to observations for four selected clear sky periods in October 1997. Steps taken to derive continuum coefficients from the observations are straightforward and outlined here. For each case, clear-sky periods were determined using a combination of observations including 1) the AERI-ER spectra themselves and their behavior for clear conditions, 2) time series of AERI-ER window channel radiances, 3) radiosondes, and 4) cloud radar. Individual AERI-ER spectra within these periods were averaged to produce mean spectra, along with uncertainties. Using profiles from Vaisala RS-80 radiosondes as input to LBLRTM, downwelling radiances were computed and convolved with the AERI-ER instrument function. Then, in deriving continuum values from the spectra, the calculations were repeated, but with the air-broadened continuum coefficients adjusted to produce agreement with the observations. No temperature dependence in Cf0 was introduced and Cs0 was not adjusted. This approach was followed independently for the case studies and for each microwindow between 380 and 596 cm-1, yielding sets of adjusted coefficients. The error bars on the AERI-ER values do not represent systematic errors that might be present in all cases.
The fact that nearly identical error signatures and derived continuum coefficients are obtained for these cases suggests that the results are not an artifact of cloud contamination or errors in the input water vapor profiles and that we are interpreting the radiance residuals in the correct manner.
Summary
From 400 to 550 cm-1, good agreement with Burch's 296K laboratory measurements is found. The coefficients of this work were derived from spectra sensitive to a range of temperatures from roughly ~230 to 260K, therefore providing evidence that Cf0 has little or no temperature dependence near 25 mm, a result which is also predicted by Ma and Tipping's (1992) calculations. Coefficients from this work, however, disagree with Burch's measurements from ~560 to 600 cm-1, where Burch's values suggest a localized increase in Cf0. In deriving the monomer lineshape associated with the initial CKDv0 model, equal weight was given to all of Burch's measurements, including the apparently erroneous values at higher wavenumbers for this spectral region. These measurements suggest that CKDv2.2 (and CKDv0) Cf0 is too large by a factor of ~3 at 400 cm-1. The results of this will be incorporated into subsequent CKD models (Mlawer et al., 1998). A combination of these continuum measurements, others further into the rotational and n2 bands, accurate measurements of individual spectral line parameters, and a consistent lineshape formulation of the observed absorption, will provide the basis for accurate retrieval of middle and upper tropospheric water vapor from satellites and a quantitative description of the role these strong water bands play in climate. Lastly the authors fully realize the sensitivity of these measurements to errors in the atmospheric water vapor profiles and the selection of clear sky cases. Further refinements will be made as additional data are obtained. Spectra at lower temperatures and water vapor amounts are particularly crucial for deriving an accurate parameterization.
This work was supported by DOE grant DE-FG02-95ER61996.
Burch, D. E. and D. A. Gryvnak, Method of calculating H2O transmission between 333 and 633 cm-1. Tech. Rep. AFGL-TR-79-0054, Air Force Geophysics Lab., Hanscom AFB, Mass., 1979.
Clough, S. A., F. X. Kneizys, R. Davies, R. Gamache, and R. Tipping, Theoretical line shape for H2O vapor; application to the continuum, in Atmospheric Water Vapor, edited by A. Deepak, T. D. Wilkerson, and L. H. Ruhnke, pp. 25-46, Academic Press, 1980.
Clough, S. A., M. J. Iacono, J.-L. Moncet, Line-by-Line Calculations of Atmospheric Fluxes and Cooling Rates: Application to Water Vapor, J. Geophys. Res., 97, 15761-15785, 1992.
Ellingson, R. G., and W. J. Wiscombe, The spectral radiance experiment (SPECTRE): Project description and sample results, Bull. Amer. Meteor. Soc., 77, 1967-1985, 1996.
Ma, Q., and R. H. Tipping, A far wing line shape theory and its application to the foreign-broadened water continuum absorption. III, J. Chem. Phys., 97, 818-828, 1992.
Mlawer, E.J., S. A. Clough, P. D. Brown, and D. C. Tobin, A New Formulation for the Water Vapor Continuum, paper presented at the 8th Annual ARM Science Team Meeting, Tucson, AZ,1998.
Sinha, A., and J. E. Harries, Water vapour greenhouse trapping: The role of far infrared absorption, Geophys. Res. Lett., 22, 2147-2150, 1995.
Stamnes, K., R. G. Ellingson, J. A. Curry, J. E. Walsh, B. D. Zak, Review of science issues, deployment strategy and status for the ARM North Slope of Alaska/Adjacent Arctic Ocean (NSA/AAO) Climate Research Site, J. Climate, 1998, in press.