A Veteran Arctic Researcher Leads an ASR- and ARM-Supported Field Campaign at the North Slope of Alaska
Near the edge of the Arctic Ocean, the Atmospheric Radiation Measurement (ARM) user facility operates the North Slope of Alaska (NSA) atmospheric observatory, which spends much of the year covered in snow.
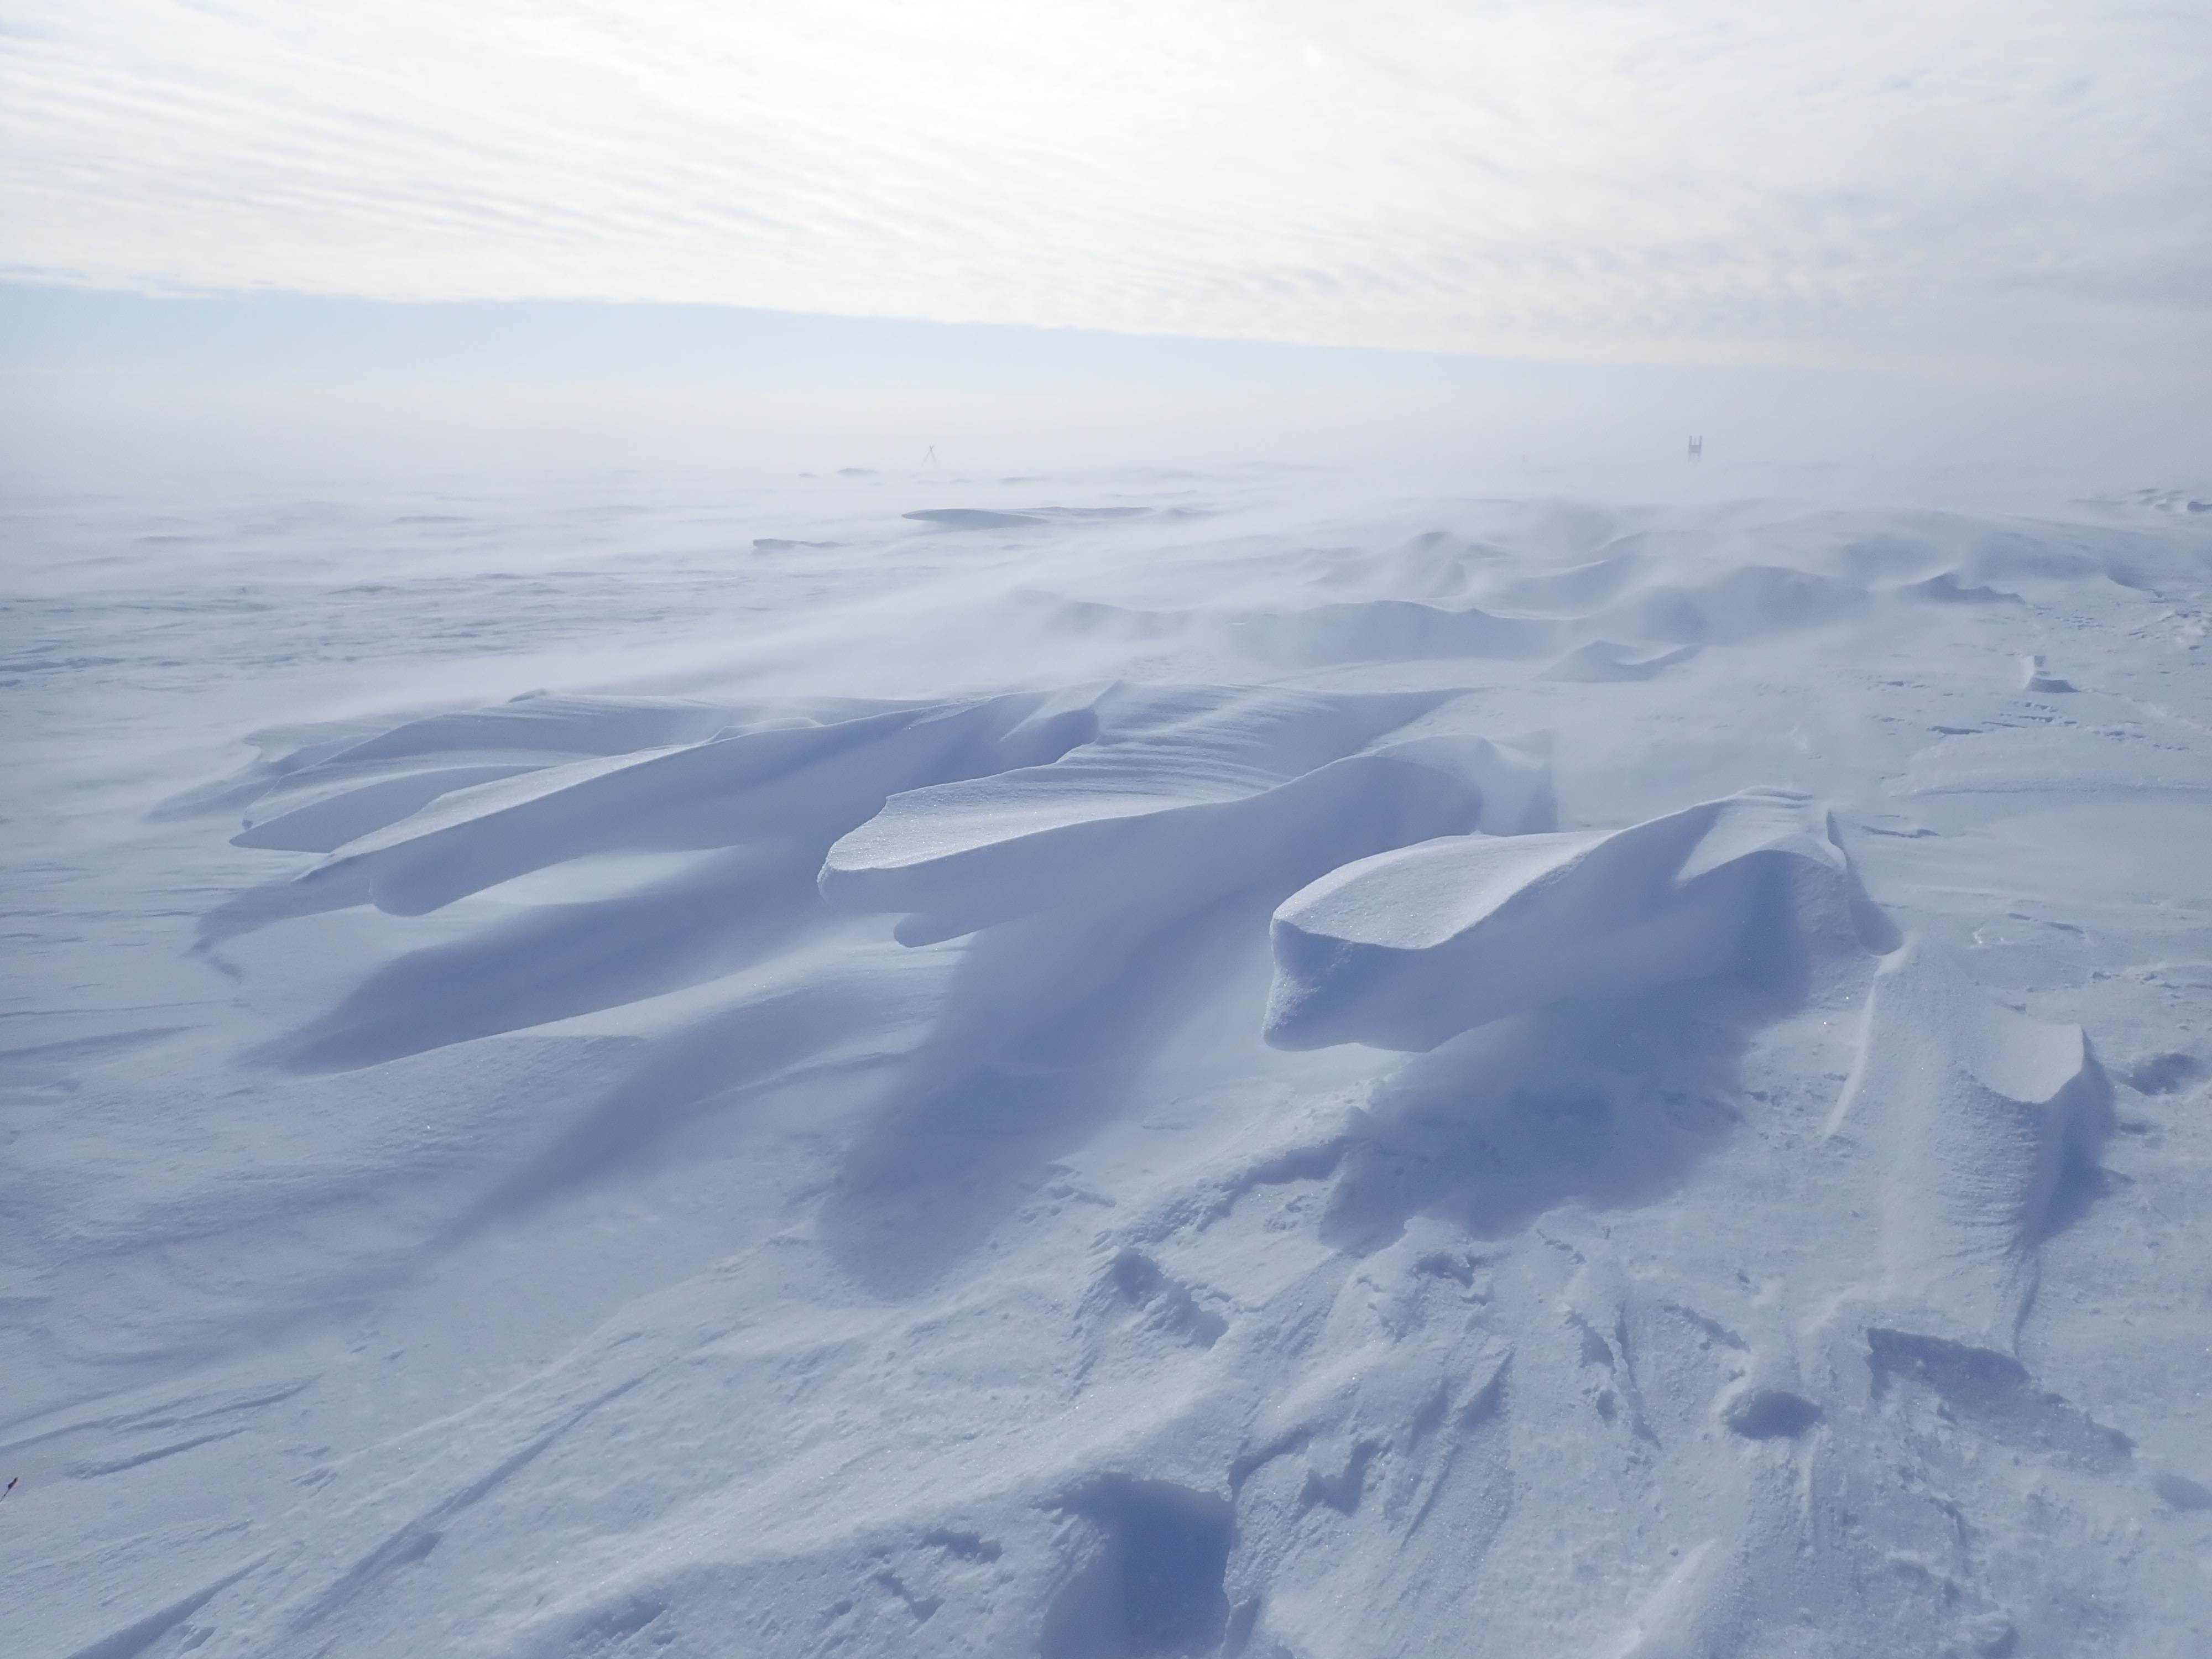
When the snow starts to melt, the visual effects can be stunning.
“The world just changes so dramatically,” says Matthew Sturm, a longtime arctic researcher from the Geophysical Institute at the University of Alaska, Fairbanks. “In the space of a couple of weeks—10 to 15 days—the world goes from being this winter white world to a world where there are birds and the tundra’s greening up, and the sea ice is melting and has holes in it, and there’s seals out on it.”
The reflectivity—or albedo—of snow can have wide-ranging effects on the local energy balance. Fresh snowfall has a high albedo, but aging or melting snow reflects less light, which warms the surface underneath. Nearby surfaces also can influence the albedo by slowing or accelerating snowmelt. Models struggle to capture these processes and how the surface looks as snow melts.
This could have major ramifications for the Arctic, which is experiencing rapid permafrost melt and surface temperatures that are increasing at twice the global average.
Sturm is the principal investigator of a three-year field campaign around the NSA observatory, which sits at the junction of land, sea ice, and the ocean. The Snow ALbedo eVOlution (SALVO) field campaign is supported by ARM and the U.S. Department of Energy’s Atmospheric System Research (ASR) program.
By combining measurements, photography, and modeling, SALVO could provide a fuller picture of how the shift from a snow-covered to snow-free landscape affects the surface albedo.
Across the Seasons
From 2019 to 2021, Sturm’s team is collecting premelt snow and albedo measurements each April at the ARM NSA site in Barrow (known officially as Utqiaġvik) and on nearby sea ice and inland tundra. It is repeating the measurements during the melt from May through June.
“It really gives us a chance to not just get the seasonal cycle, but to see how things vary from year to year and start to be able to determine what parameters have the biggest impact on the evolution of the albedo,” says co-investigator Don Perovich, a professor in the Thayer School of Engineering at Dartmouth College.
Pinning down exactly when to return for the melt was a tricky task this year.
“Even though I’ve been working in and out of Utqiaġvik for close to 30 years, that’s still a guessing game,” says Sturm. “We came back May 18, which perhaps was too early. There’d been a small melt event, and then it shut down and it got cold again.”
The group’s last day in the field was June 18, and “we still had just a bit of snow to measure,” he says.
Perovich and co-investigator Jennifer Delamere, a research scientist from the Geographic Information Network of Alaska at the University of Alaska, Fairbanks, are working on SALVO’s radiative transfer component.
Physical measurements of the snowpack and the surface albedo measurements will be used to describe the snow’s optical properties. From those properties, says Delamere, researchers can further explore the effects of rapidly changing surface conditions on the NSA’s radiation balance.
RRTMGP, the third generation of the rapid radiative transfer model RRTM, will be the modeling foundation for these studies. Developed by physicist Eli Mlawer and colleagues starting in the 1990s with ARM’s support, RRTM is a reference fast radiation code for scientific applications. The code resulted from early ARM efforts to improve calculations of clear-sky radiative transfer.
“Through the efforts of ARM, we’ve basically gotten better and better at being able to do these calculations start to finish,” says Delamere, a developer for all three generations of the model. “It’s a real success for ARM.”
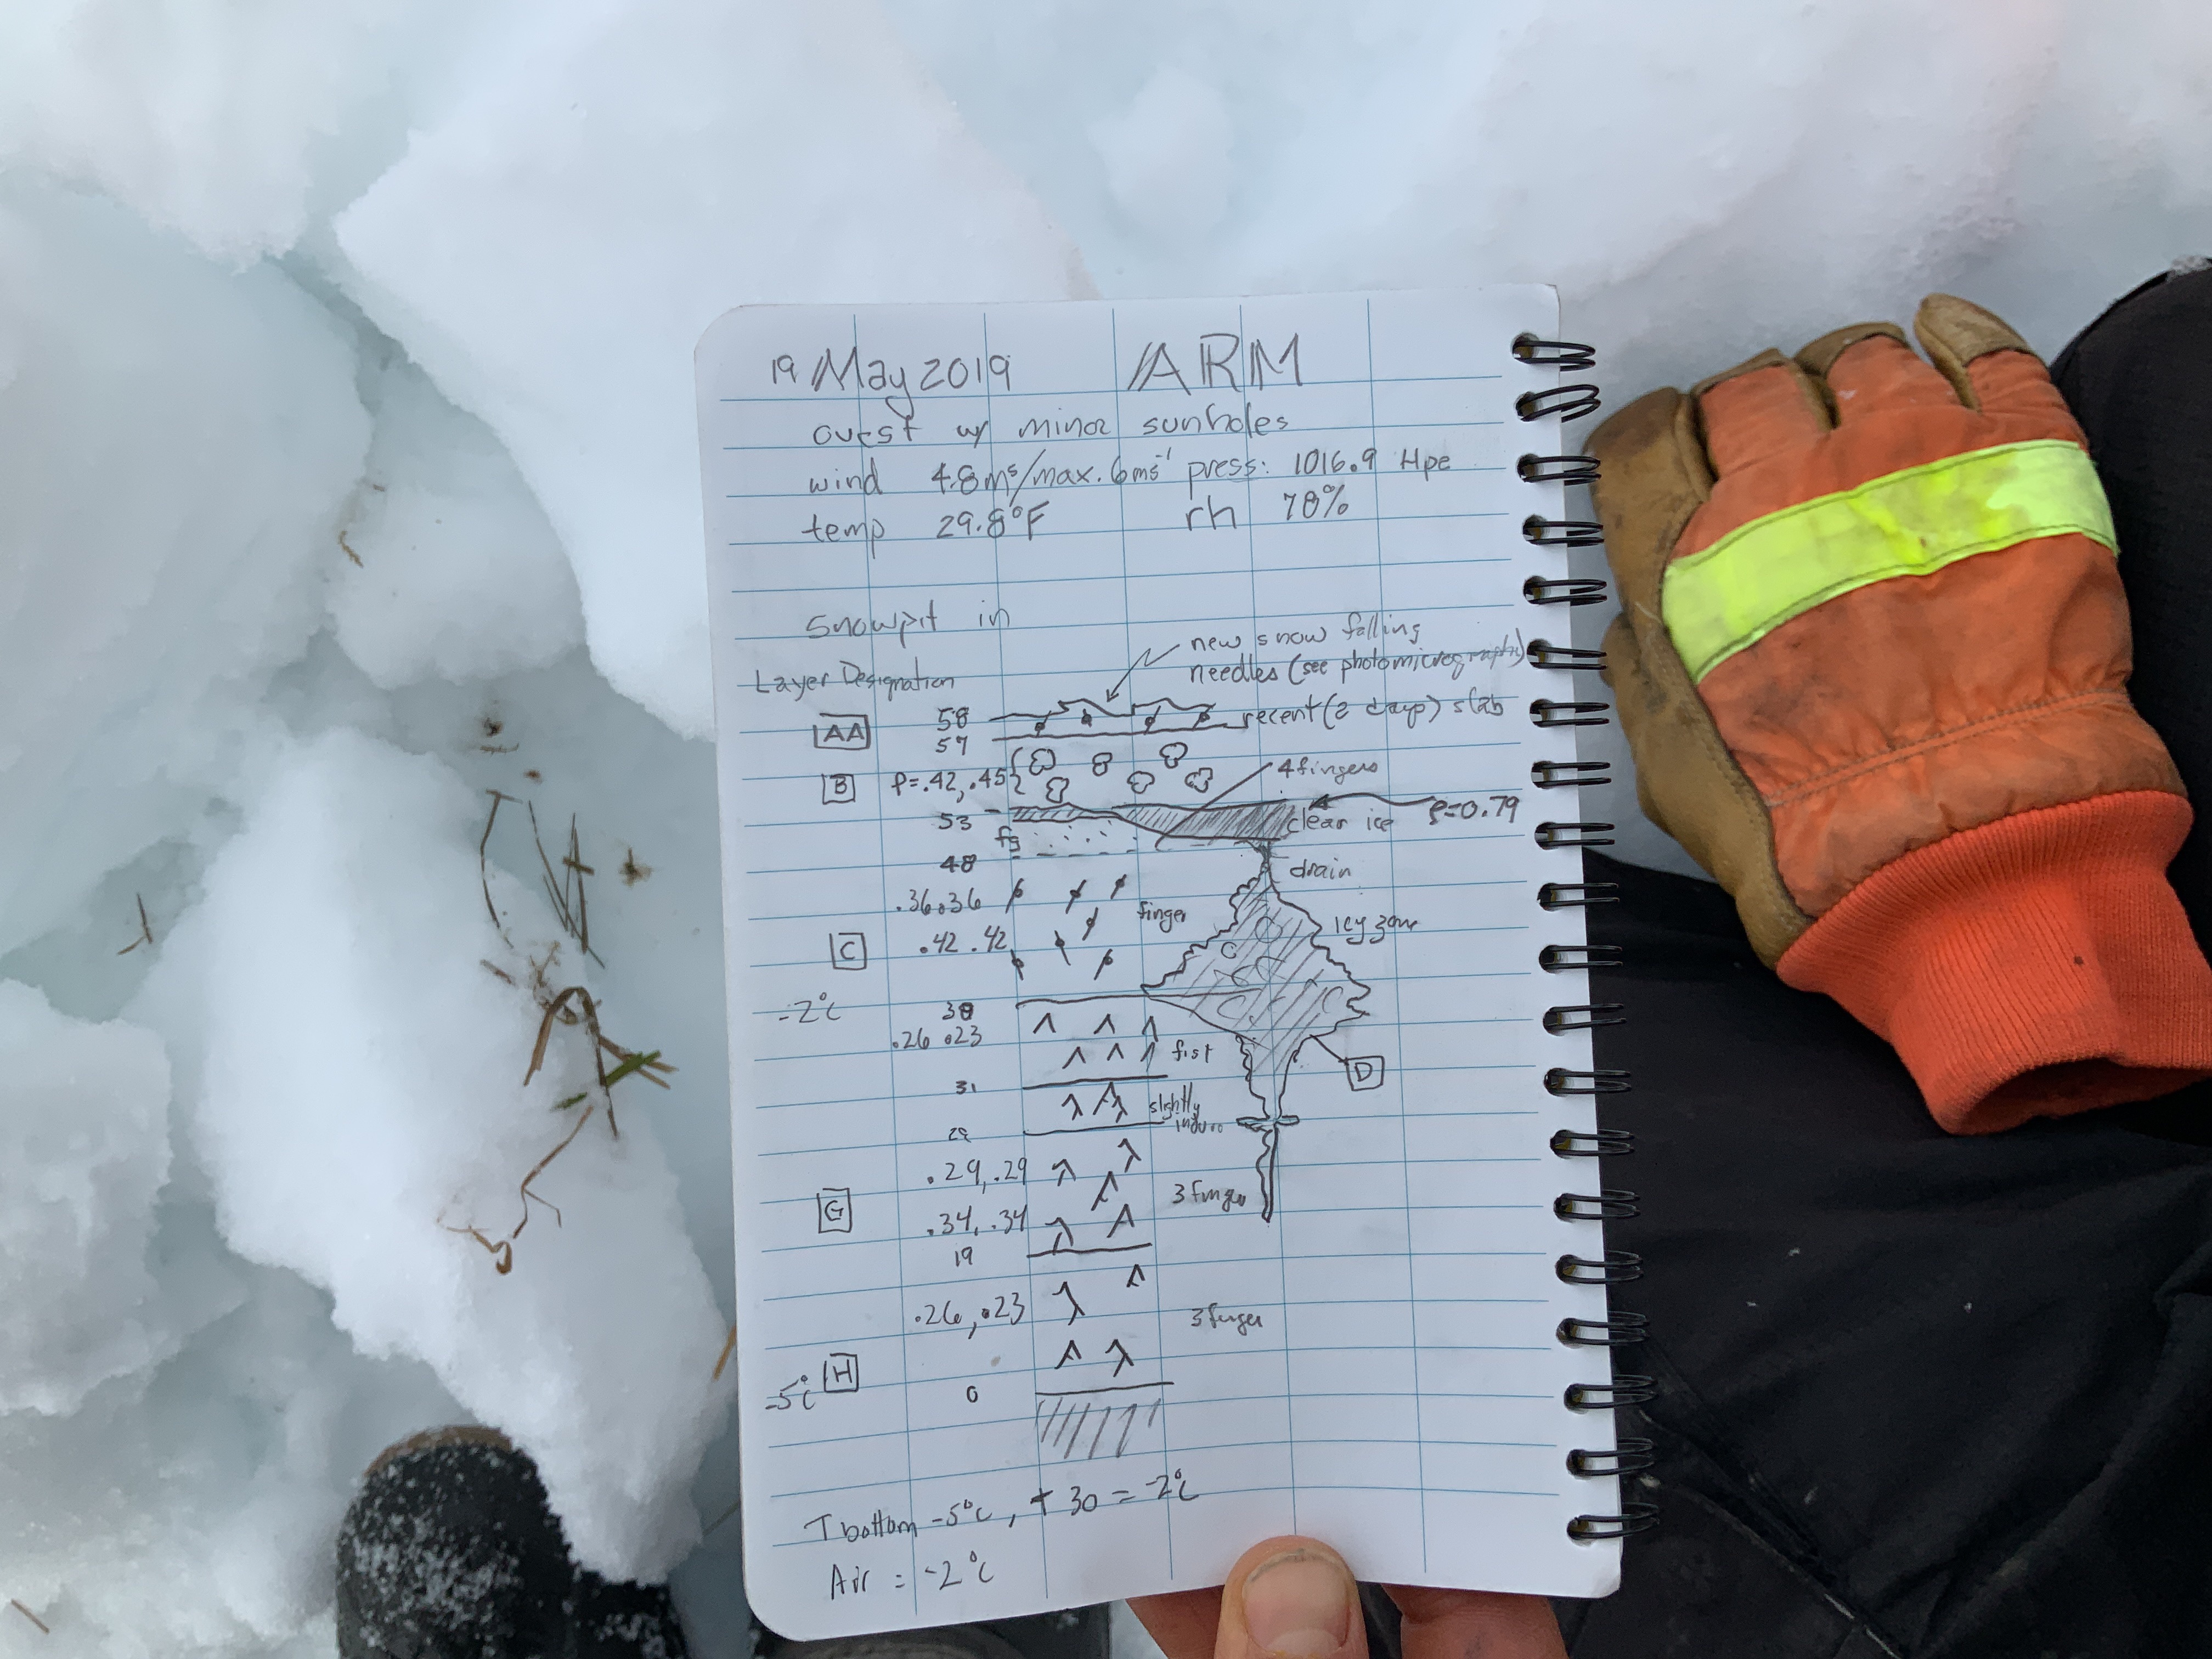
In the Field
Sturm’s team traveled to the North Slope in April to establish a 200-meter (656-foot) survey line for taking measurements at the NSA, on the tundra, and on the sea ice.
Wearing a backpack with a spectral radiometer inside, Sturm walked along each of the three survey lines and stopped every 5 meters (16 feet) to measure the spectral albedo. The spectral radiometer collects both incoming and outgoing radiation across 2,000 individual wavelengths.
“I think now there’s a realization that to understand what’s going on in the Arctic, you have to treat this as a system—a system of highly interconnected parts.”
Sturm pointed a fiber optics probe skyward to measure the sunlight streaming in and then downward to capture how much light was bouncing off the surface.
“You can ratio those (divide how much light is reflected by how much is coming in) and get 2,000 albedos,” says Sturm, whose team is also using ARM NSA radiometer data.
To measure snow depth, the team is using an instrument developed by Sturm, called a magnaprobe. The instrument consists of a rod similar to a ski pole and a basket that skims the snow surface. After pushing the rod’s tip down to the base of the snow, the user presses a button to lock in the distance—or snow depth—between the tip of the rod and the basket on top of the snow.
Sturm says that, as expected, the snowmelt on land kicked into gear once the tundra became exposed. On the sea ice, melt ponds kept capping over and refreezing.
“In some ways, the sea ice hung out longer, if you will,” he says. “It was able to preserve the snow longer, keep its color whiter and brighter, and therefore reflect more sun.”
To map the snow cover, the team used GoPro cameras to capture what the lines looked like every time they took albedo measurements. This will also help the group reconstruct the snow depth—“where it’s steep, where it’s shallow, where it’s just tundra,” says Sturm.
Snow Albedo and MOSAiC
Similar measurements will be taken during the Multidisciplinary Drifting Observatory for the Study of Arctic Climate (MOSAiC) field campaign, which started in September 2019. The icebreaker R/V Polarstern froze into an ice floe in October and is drifting through the central Arctic for a year so researchers can gather measurements related to the atmosphere, ocean, sea ice, and biosphere.
Perovich was chief scientist for the 1997‒1998 Surface Heat Budget of the Arctic Ocean (SHEBA) field campaign. Like MOSAiC, SHEBA froze an icebreaker into drifting arctic ice to collect continuous data for a full year.
Perovich will join the MOSAiC expedition in the summer of 2020.
“I think that will give us an idea, an opportunity, to do some comparing and contrasting to the process that occur in the coastal region and also in the central Arctic,” says Perovich. “That’s really pretty exciting.”
When it comes to snow cover and albedo, he says, researchers want to know if the land influences the ocean or vice versa. Perovich believes the same processes are happening in both Alaska and the central Arctic, but possibly at different times and rates.
“I think now,” he says, “there’s a realization that to understand what’s going on in the Arctic, you have to treat this as a system—a system of highly interconnected parts.”
# # #This work was supported by the U.S. Department of Energy’s Office of Science, through the Biological and Environmental Research program as part of the Atmospheric System Research program.