Nearly 8% of genetic males and 0.5% of genetic females have some form of Color Vision Deficiency (CVD)
Editor’s note: The original version of this story by Marguerite Huber appeared on the Argonne National Laboratory website.
Imagine having to do your job, but not being able to visually process the data right in front of you. Nearly 8% of genetic males and 0.5% of genetic females have some form of color vision deficiency (CVD), or the decreased ability to discern between particular colors. CVD is commonly referred to as color blindness.
Scientists use colors to convey information. Many scientists in the weather radar community have CVD, and the use and interpretation of color is an important aspect of their work. Most colormaps don’t take into account those with CVD; for instance, the maps show green next to red.
A team led by scientists at the U.S. Department of Energy’s (DOE’s) Argonne National Laboratory recently published a paper in the Bulletin of the American Meteorological Society detailing their work to create CVD-friendly colormaps that highlight important characteristics of clouds and precipitation.
DOE’s Atmospheric Radiation Measurement (ARM) user facility supported their research.
“ARM is facilitating great science, visualizations, and tools that are open to the community,” said Scott Collis, an Argonne atmospheric scientist and co-author of the paper. “Without ARM, none of this would be possible, and in practicing open science, ARM data, tools and software are more impactful.”
A Dedication to Inclusivity
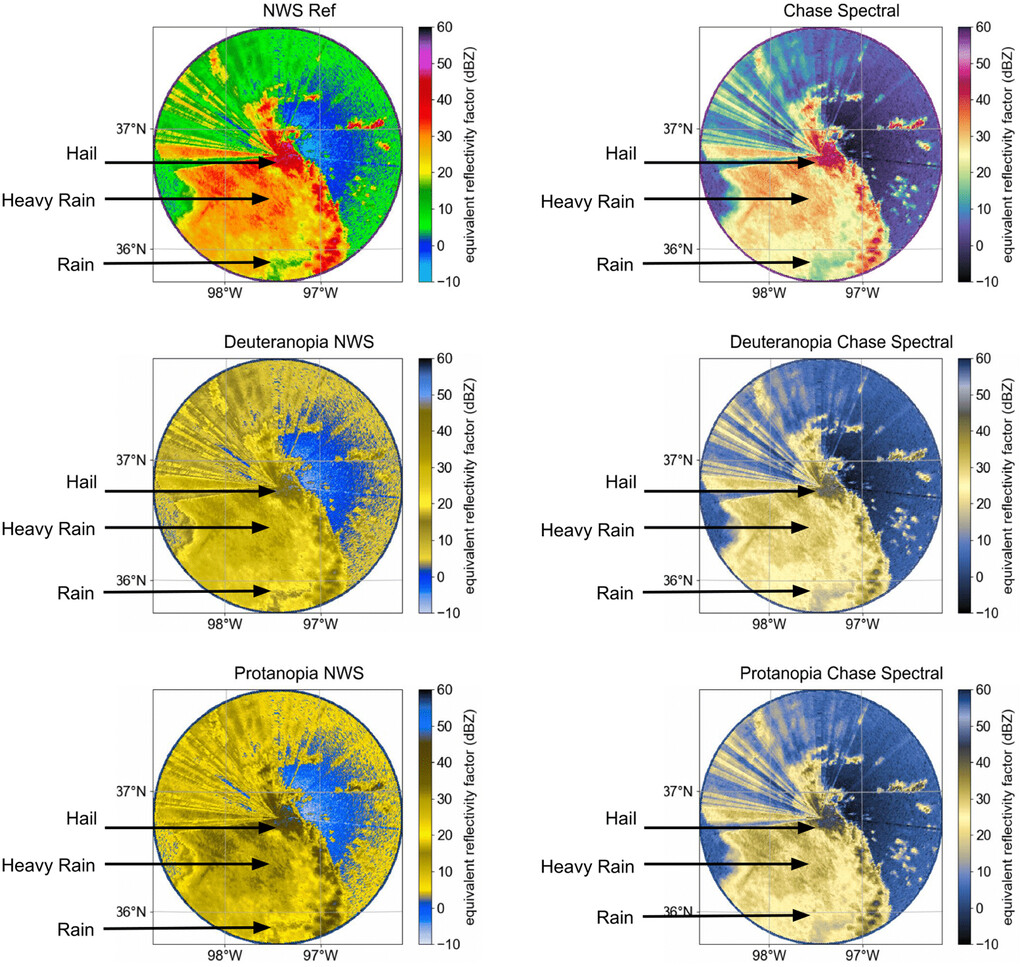
One type of colormap, Ze, shows radar reflectivity or storm intensity. The higher the reflectivity factor, the higher chance there is for rain, hail, and more. In general, the higher the Ze, the higher the chance of public impact. These colormaps are ones most commonly seen by the general public in local weather forecasts.
Some colormaps, like Ze, are difficult for individuals with CVD to distinguish between varying types of precipitation and convection. Convection is the transport of heat and moisture by the movement of a fluid. Thunderstorms are one form of convection. Another problem with the current colormaps is that they are not perceptually uniform. Perceptual uniformity is when changes in color (lightness or color) and data values are weighted equally and do not create artificial structure.
As the scientists interacted with the community, they realized they needed to do a better job displaying data. Their work focused on finding the right color representation that was both CVD-friendly and good for the radar community. The researchers took this knowledge and created CVD-friendly Ze and velocity colormaps using Python programming language tools. They gave everything its own color, from drizzle to rain to hail. Velocity colormaps were also tested using an existing oceanography map.
“The Python programming community aims to be inclusive,” said Collis. “And there was this push from users to make colormaps more accessible.”
A Longer-Term Impact
The new and existing colormaps were tested on different weather events using software that visualized the data through the eyes of an individual with CVD. Comparisons were then provided to the CVD community for their input and feedback. Overall, radar researchers in the focus group agreed that the new colormaps were more interpretable than the default colormaps currently utilized.
The new colormaps are now available in a GitHub repository that is used by a variety of open-source radar software packages found in the open radar community.
To further engage the CVD community, the authors presented their colormaps at important scientific conferences around the world. The community provided feedback, tested colormaps, and helped build the library.
“Now that we have better colormaps, we know from the community that they are relevant and inclusive,” said co-author and Argonne Systems Integration Admin Zachary Sherman. “People have a choice to be colorblind-friendly.”
Some of the authors have personally experienced how their colormaps have impacted those with CVD. Everyone from students to conference co-chairs have expressed their gratitude for colormaps they could finally understand. Providing these CVD-friendly colormaps allows for equitable scientific visualization and inclusivity.
Going forward, the research team plans to develop more colormaps and complete additional outreach. Their goal is to build a community practice around the world.
“Radar meteorology is a unique visual science,” said Collis. “Scientists can see the shape in the storm that would signal strong winds or a tornado. That is why colormaps are so important to our community.”
Eventually, members of the radar community won’t be the only ones to benefit from CVD-friendly colormaps. That’s because the landscape of future meteorologists is changing. As up-and-coming students finish their studies, they are working exclusively with radar meteorology tools that feature CVD-friendly colormaps. Those types of colormaps are the norm for the next class of meteorologists.
Then, as they take on roles at local television channels, they will start to bring inclusive colormaps to general audiences through weather reports. So, one day in the near future, the general CVD population will be able to watch the morning weather forecast and be able to see, for the first time, how a colormap was meant to be seen.
# # #
This work was supported by the U.S. Department of Energy’s Office of Science, through the Biological and Environmental Research program as part of the Atmospheric System Research program.